What NextChapter publishes, what each figure means, how to cite it, and where to get the files. We build the numbers from public data and publish the code, so every figure can be checked.
Page wording reviewed October 27, 2026. Each figure below shows its own as-of date and updates on its own.
The report follows the BLS jobs report; the reports page lists the next release dates.
Figures you can cite
White-Collar Long-Search Index
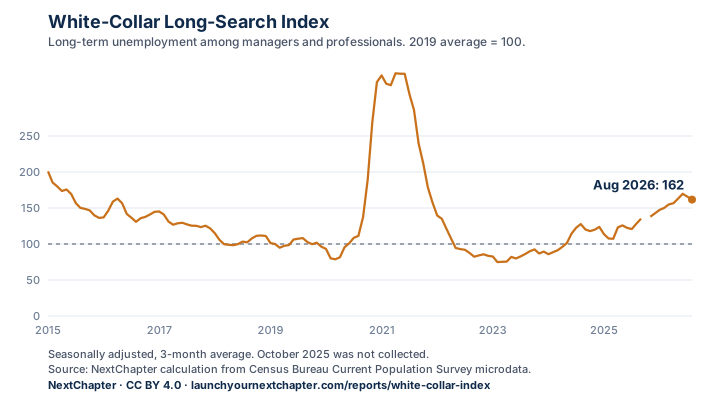
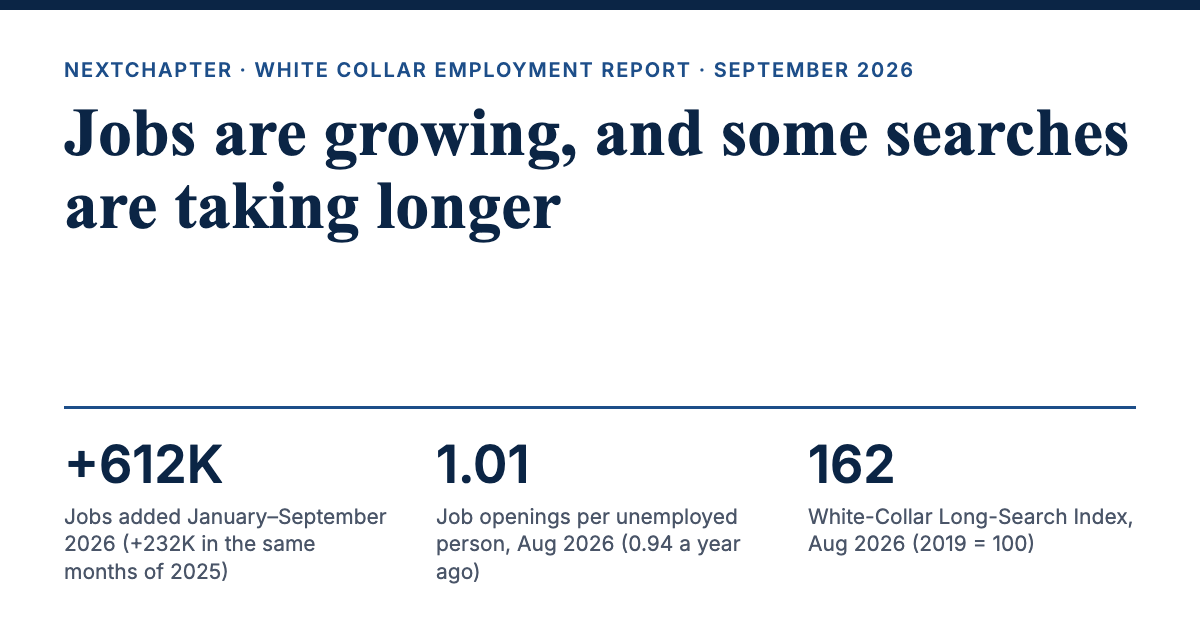
162 in August 2026 (2019 = 100)
161.6 in the data file; 128.2 a year earlier, a change of +33 points. Seasonally adjusted, 3-month average. Headline index levels are rounded to the nearest whole point; the data file keeps one decimal. A change is worked out from the one-decimal values and then rounded, so it can differ from the difference of the two rounded levels.
The margin of error on a single month’s reading is roughly ±24 points, so one month is not statistically different from the same month a year earlier on its own. The January–August comparison is. Margin of error band on the index level: about ±11% (90%, BLS variance method).
How to cite
NextChapter, “White-Collar Long-Search Index”, data through August 2026, https://launchyournextchapter.com/reports/white-collar-index. Accessed [date accessed]. Licensed CC BY 4.0.
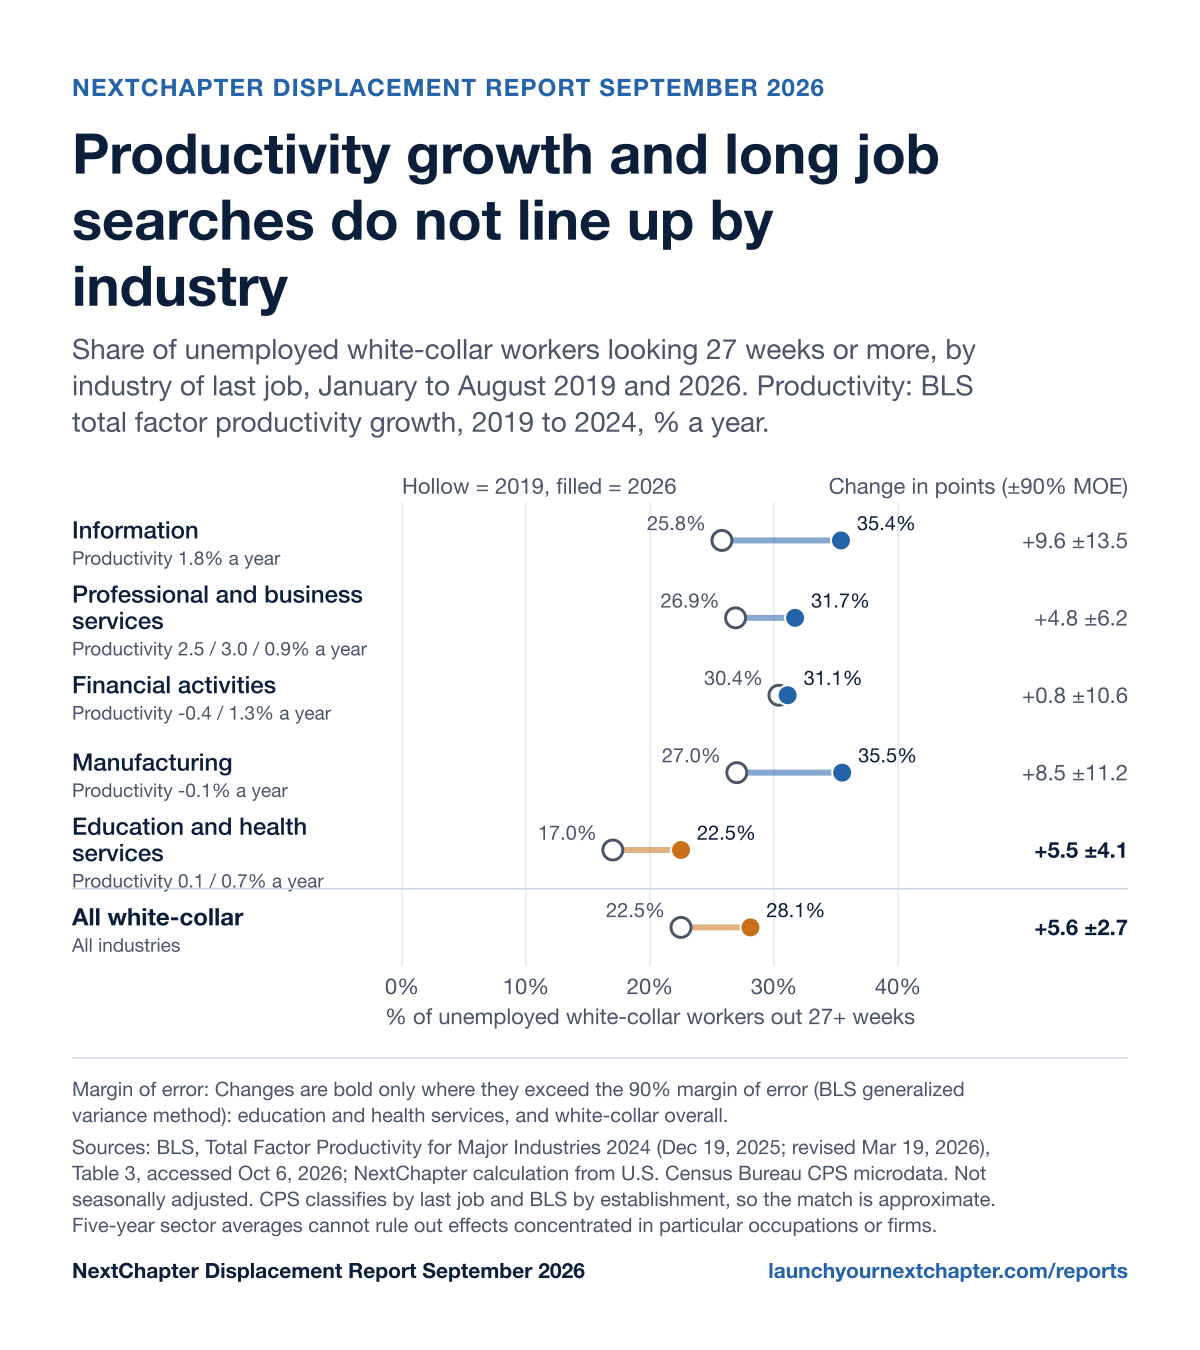
28.1% of unemployed white-collar workers, vs 22.8% a year earlier
January–August 2026 compared with January–August 2025, not seasonally adjusted. The change is +5.3 points, with a margin of ±2.4 at 90%, so it is beyond the margin of error. For all unemployed workers the share is 25.6% against 22.4% (+3.2, ±1.2). The index sits 53–62% above its 2019 level, depending on the seasonal-adjustment method.
Single-month figures for smaller groups, such as workers 45 and over, swing widely from month to month and have no published margin of error. We do not quote them.
How to cite
NextChapter, “White Collar Employment Report, September 2026: unemployed workers out 27+ weeks, January–August 2026 vs 2025”, September 2026 edition, https://launchyournextchapter.com/reports/white-collar-employment-report-september-2026. Accessed [date accessed]. Licensed CC BY 4.0.
September 2026 report · NextChapter calculation from U.S. Census Bureau Current Population Survey microdata. Margins of error are 90% margins on the change, by the BLS generalized variance method.
Layoff tracker and WARN notices
2,070 layoffs in 2026 naming 299,439 workers
Counted once per employer, state and notice date, filed or reported with a U.S. state, as of Oct 27, 2026. The download holds 3,392 WARN filings naming 378,871 workers over the last 24 months (since Feb 18, 2025), one row per filing. 89 announcements this year with no U.S. state (161,725 workers) are not counted anywhere. The two counts use different units; How we count defines each. A state notice list is a floor, not a count of every layoff.
How to cite
NextChapter, “NextChapter layoff tracker, WARN Act notices collected from state labor departments”, as of Oct 27, 2026, https://launchyournextchapter.com/layoffs. Accessed [date accessed]. Licensed CC BY 4.0.
+44.7% raw, +16.9% matched on function, level and industry
Median advertised pay is $195,500 across 12,214 paid postings that ask for a specific AI skill, and $135,000 across 16,496 that never mention AI. This compares advertised pay between postings; it is not what anyone is paid and it does not show that a skill causes a raise. Data as of 2026-10-26.
How to cite
NextChapter, “AI-skill pay premium in U.S. job postings”, data as of 2026-10-26, https://launchyournextchapter.com/resources/ai-skills-pay-premium. Accessed [date accessed]. Licensed CC BY 4.0.
Source: U.S. Census Bureau Current Population Survey basic monthly public-use microdata. No NextChapter customer data is used.
White-collar means current or most recent job in management, business and financial, or professional and related occupations.
The index is long-term unemployed (27+ weeks) as a share of the white-collar labor force, seasonally adjusted, 3-month average, 2019 average = 100.
Margins of error are 90% margins from BLS generalized variance functions; they can understate variance for small groups.
Code is MIT License and data is CC BY 4.0 (attribute "NextChapter White Collar Employment Report"); both are in the public repository.
Known limitation: Margins of error use BLS generalized variance functions because Census does not publish replicate weights for the public-use monthly files. These can understate variance for small groups. Full list on the replication page.
If a figure is wrong, write to justin@launchyournextchapter.com. We fix it where it appears and record the change here with its date.
October 27, 2026. White-Collar Long-Search Index page: the year-over-year change was worked out from the two rounded levels (162 minus 128 = 34). From the unrounded values it is 33.4, now shown as 33. The levels (161.6 for August 2026, 128.2 for August 2025) and the data file did not change.
Contact
Justin Kulla is the founder of NextChapter. He has spent nearly 20 years as an investor, founder and operator in education technology. He founded BusinessBlocks, a venture-backed education company for small businesses, and led it as CEO through an exit to AmTrust Financial, where he became SVP and Head of Global M&A and Venture Investments. He is a Partner at TZP Group, where he leads impact and education investments, and was a founding member of Weld North. He holds an MBA from MIT, a Master of Public Administration from Harvard and a master’s in Information Systems Management from Carnegie Mellon. More about Justin.